The flagship spreadsheet ยท Excel + Google Sheets

Host Profit & Operations Tracker

A spreadsheet that shows which listing actually makes money, with the turnover calendar, maintenance log and tax-year summary beside it.

  • Profit, margin and break-even nightly rate for each listing
  • Payout check that flags when a payout does not match the booking
  • 60-day cleaning schedule that flags same-day turnovers
  • Maintenance and restock tabs built in
  • Sample file, blank file and a landlord sample included

$29

Get the Host Profit & Operations Tracker

Instant download after checkout.

Instant download · Free updates for all v1.x versions
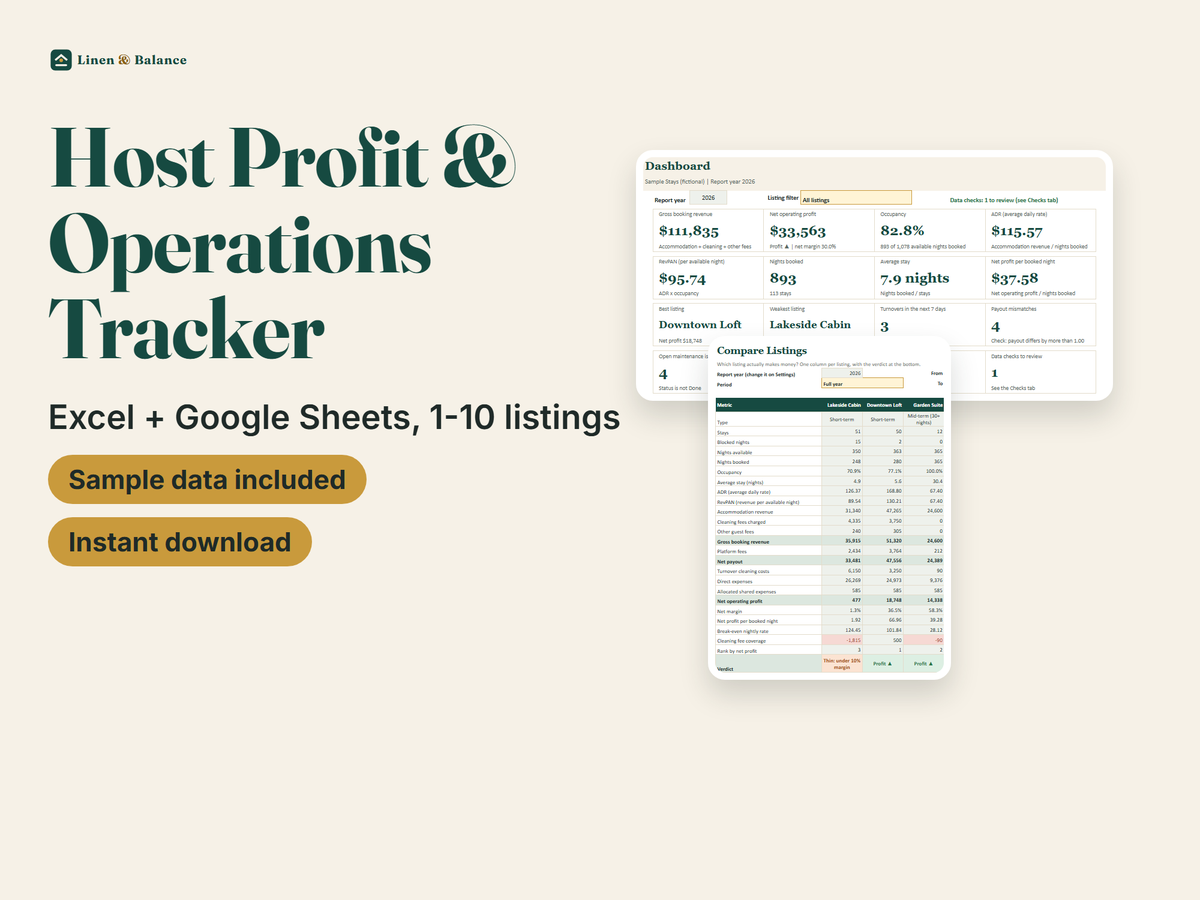
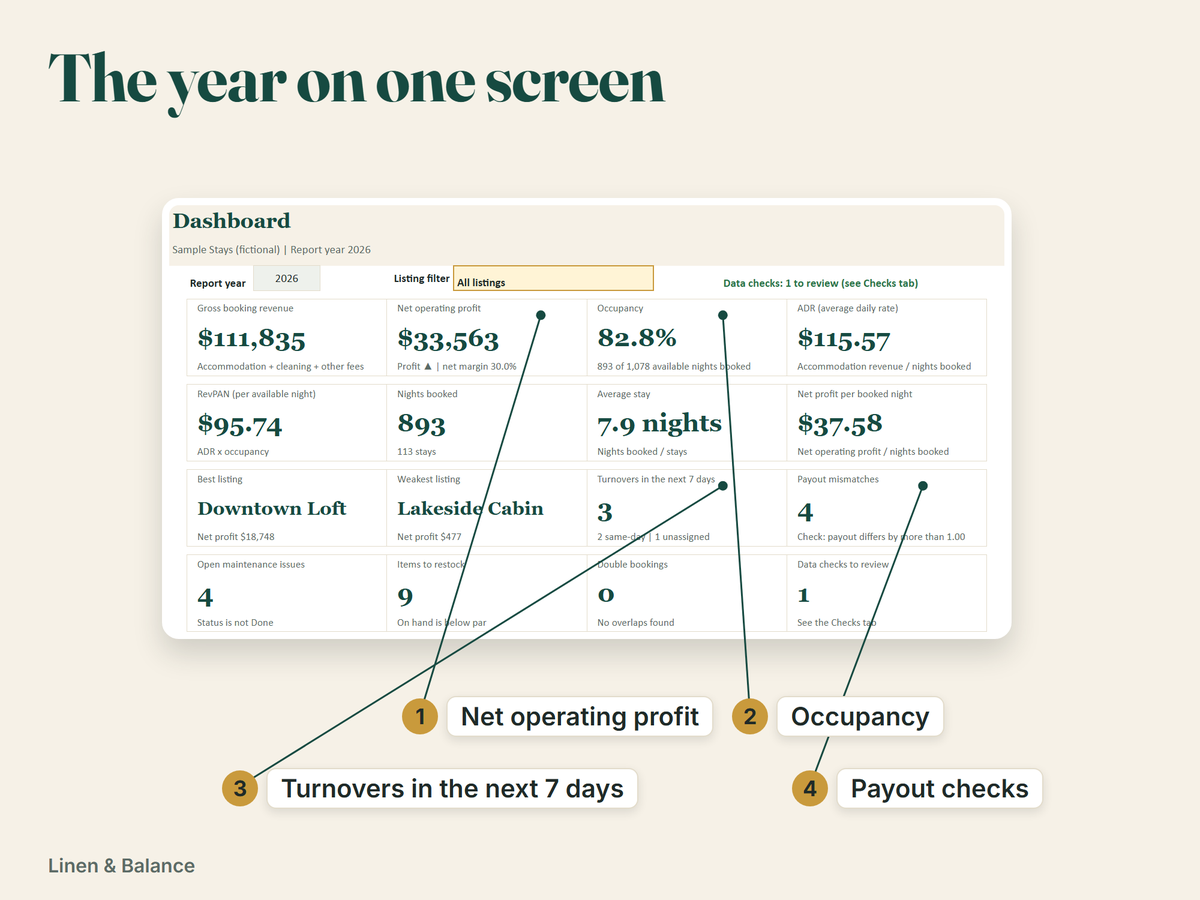
The tracker dashboard with key figures and charts

The question it answers

A calendar that is full does not mean a listing is making money. Payouts arrive after fees, the cleaner is paid separately, repairs and supplies pile up, and the numbers end up across bank statements and a notes app.

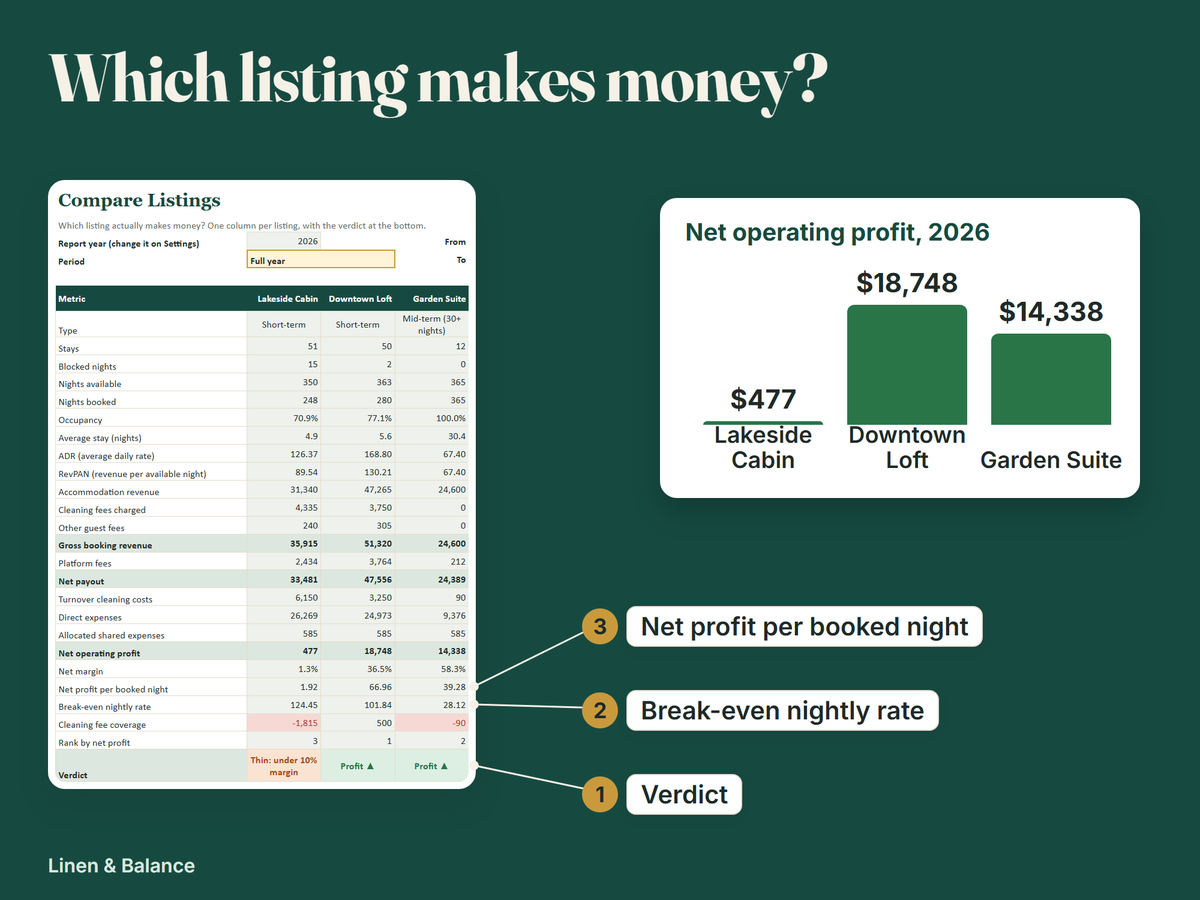
The tracker puts bookings, cleaning costs and expenses in one workbook and works out the real result for each listing. On the Compare Listings tab you see every listing in one column each: occupancy, average nightly rate, net profit, margin, and the break-even nightly rate, which is the rate you need to cover costs at your current occupancy.

What is inside: 14 tabs

Results

  • Start Here: setup in 3 steps, color legend, which file to use
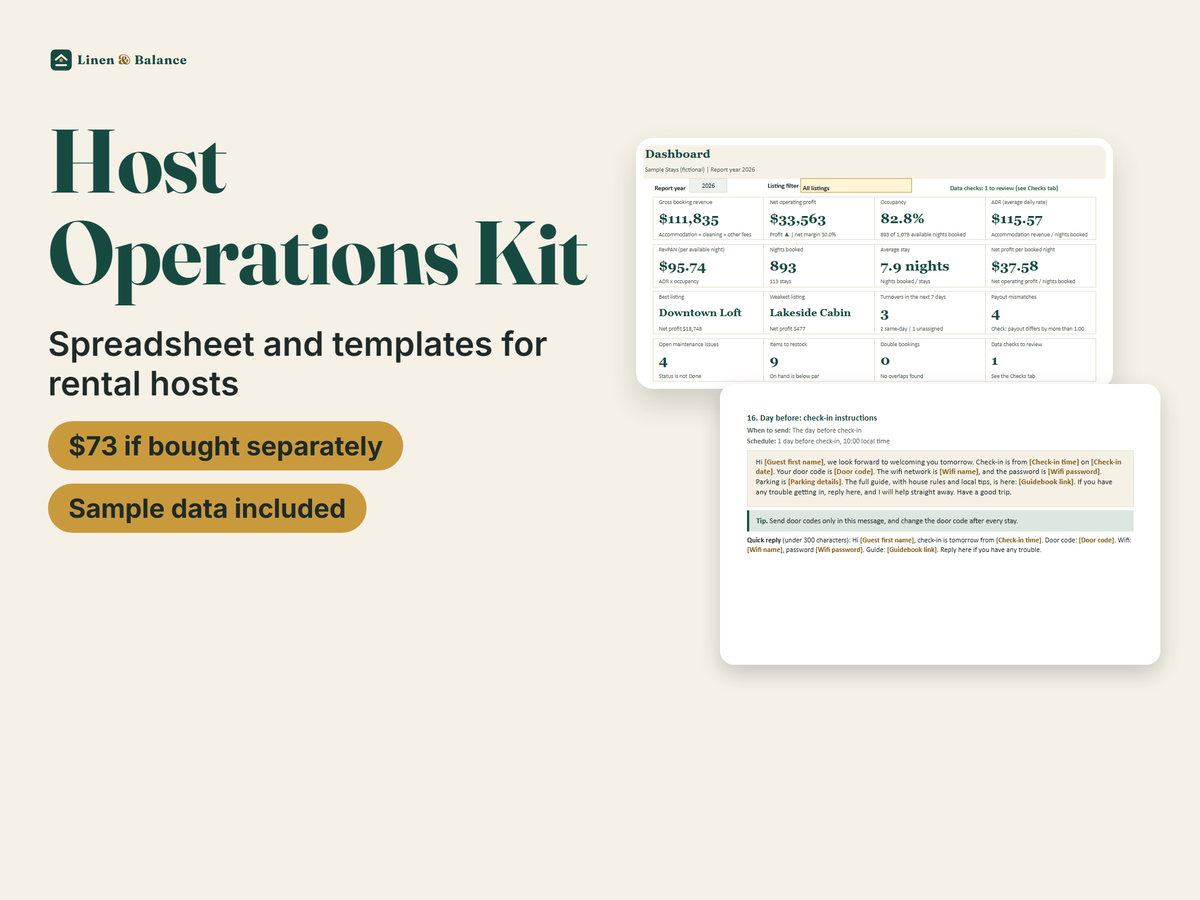
  • Dashboard: key figures and 4 charts for the year, filter by listing
  • Compare Listings: which listing makes money, ranked, with a verdict
  • Monthly P&L: January to December plus year total
  • Tax Summary: your records grouped by tax category for the tax year

Data entry

  • Bookings: one row per stay, with the turnover columns on the same row
  • Expenses: 22 categories mapped to 14 tax groups
  • Cleaning Schedule: 60 days across up to 10 listings
  • Maintenance Log: repairs plus a preventive schedule
  • Restock List: par levels and reorder flags
  • Listings: up to 10 listings and their defaults

Settings

  • Settings: currency symbol, report year, tax-year start month, booking channel names, cleaners
  • Lists: the dropdown sources
  • Checks: data health checks that flag anything to fix

The default channel names are neutral (“Listing site 1” and so on). Rename them once to match yours.

The numbers it works out

Occupancy
Nights booked divided by nights available.
ADR (average daily rate)
Accommodation revenue divided by nights booked. Cleaning fees and taxes are left out.
RevPAN (revenue per available night)
Accommodation revenue divided by nights available.
Net operating profit
Net payout, minus turnover cleaning costs, direct expenses and your share of shared expenses. It is before income tax, loan principal and depreciation.
Break-even nightly rate
The nightly rate that covers your costs at the current occupancy.
Cleaning fee coverage
Cleaning fees charged minus what you pay for cleaning. A negative number means the fee does not cover the clean.

Every definition is written out on the sheet itself, so you can check any number.

How it works

  1. Download and open

    Open the sample file to see a full year with fictional listings, then open the blank file for your own data.

  2. Add listings and settings

    Up to 10 listings, your currency symbol, your tax-year start month and your booking channel names.

  3. Log bookings and expenses

    One row per stay and one row per cost. Cleaning costs ride on the booking row.

  4. Read the verdict

    Compare Listings shows profit, margin and the break-even rate, with the weakest listing flagged.
See inside

Files and compatibility

Files
3 workbooks (sample, blank, landlord sample) plus a 10-page Quick Start PDF
Works in
Excel for Microsoft 365 / 2019 or newer (Windows and Mac), and Google Sheets by import; the Quick Start shows how.
Not supported
Apple Numbers and Excel 2016
Capacity
10 listings, 2,000 bookings, 3,000 expense rows, 500 maintenance rows, 200 restock items, 10 cleaners, any year
Built without
Macros, add-ins, external links or anything that needs enabling
Currency
You pick the symbol in Settings; money cells carry no fixed currency
Modes
Short-term, mid-term (30+ nights) and long-term monthly rent, so small landlords can use it
Updates
Free for all v1.x versions

Is this for you?

A good fit if

  • You want profit per listing, not just revenue
  • You manage 1 to 10 listings yourself or as a co-host
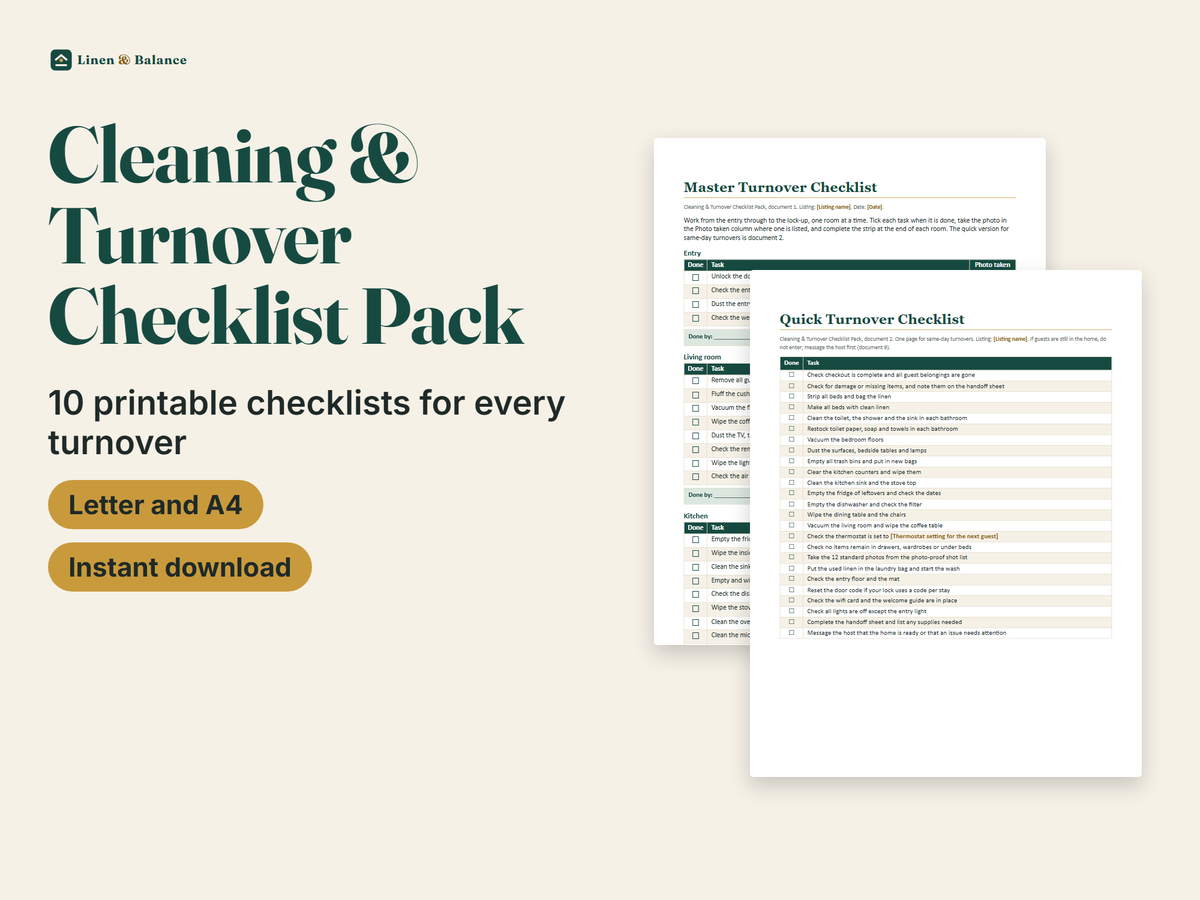
  • You also want cleaner turnovers, maintenance and restock in the same file

Not the right fit if

  • You need bank feeds, invoicing or full accounting
  • You need tax filing or tax advice
  • You only have Apple Numbers or Excel 2016

Questions

Do the spreadsheets work in Excel and Google Sheets?

Yes. The tracker is built for Excel for Microsoft 365 / 2019 or newer (Windows and Mac), and Google Sheets. To use it in Google Sheets, import the Excel file. The Quick Start guide and our Updates and help page show each step. Apple Numbers and Excel 2016 are not supported.

Do the files use macros or add-ins?

No. The workbooks use standard formulas only, so there is nothing to enable and no security warning to click through.

Does it work for long-term rentals or a mix?

Yes. Each listing in the tracker can be short-term, mid-term (30 nights or more) or long-term monthly rent, so a small landlord can use it too.

Can I use my own currency?

Yes. Pick your currency symbol once in Settings and every label follows. Prices on this site are in US dollars.

Is there sample data?

Yes. The tracker comes as a sample file filled with fictional listings, a blank file ready for your own data, and a landlord sample. The templates use [square-bracket placeholders] that you replace with your own details.

Is this tax advice?

No. It is a record-keeping tool. Check tax rules and any filing with a qualified professional in your country. The Tax Summary tab groups your own records to make that conversation easier.

These spreadsheets help you record your own rental data. They are not tax, accounting, legal or financial advice. Check tax rules and any filing with a qualified professional in your country. Full disclaimer

Want the whole system?

The Host Operations Kit includes this and four more products plus two bonus guides, for $49. That saves 33% compared with buying them one by one.

More from Linen & Balance